Cold Chain Cloud is a cloud-based SaaS service that solves two main tasks:
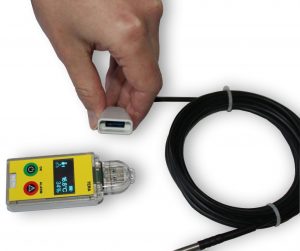
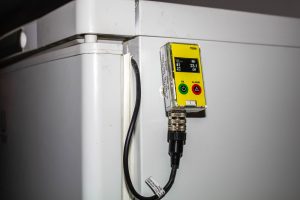
- The first is the collection, monitoring, and centralized storage of data from a large number of measuring instruments (loggers, sensors, recorders, etc.). Measuring instruments can interact with Cold Chain Cloud using various data exchange protocols and be located in different geographical regions;
- The second is providing authorized user access to measurement data through a web interface and displaying this data in a user-friendly format.
Cold Chain Cloud is a platform-independent service. The user interacts with Cold Chain Cloud through a web browser, without the need to install any additional software on their computer.
The advantage of Cold Chain Cloud lies in its client-server architecture. This architecture allows part of the data processing load to be offloaded from the server to the client’s device, thus improving system performance and reliability.
The server side provides, on one hand, interaction via the server API with measuring instruments (loggers, sensors, recorders, etc.). On the other hand, the server interacts with the client side through a client API, delivering data based on the user’s requests. Therefore, the main functions of the server side are data collection, preliminary processing, storage, backup, and provision of data to the client side.
The server side is software written in JavaScript (Node.js) and C++. It runs under the Linux OS and is hosted on servers in a data center. The client side is a JavaScript (AngularJS) application that automatically loads in the user’s web browser and operates until the browser tab is closed. The client-side service provides interfaces for real-time user interaction with data, such as: graphical visualization of historical data from all devices, viewing charts, archives, logical events, alarms, various widgets, system settings, and more.
Cold Chain Cloud offers a flexible user access control system, preconfigured by the system administrator. Users can be divided into different groups with different privileges and roles: administrators, operators, users, etc. Depending on their permissions, a user can modify or view only the data and devices available to them.
Online data received from various instruments can be grouped by common characteristics. Charts, reports, and tables can be built for these groups, and alarm thresholds can be configured.
Cold Chain Cloud allows users to monitor and control instruments remotely in real-time, view data archives, create charts, tables, and reports for specific time periods, and export data to PDF files. Chart scales on X and Y axes can be adjusted, additional axes can be added or removed, and axes, colors, and line types can be customized. Detailed charts can display either a single selected parameter or a group of parameters. Above the detailed chart area, a “timeline” widget with a preview of chart trends is implemented. This widget allows users to quickly and intuitively select the desired time range for detailed chart building.
Cold Chain Cloud includes a flexible alarm configuration system. Alarm thresholds can be set, and users can be configured to receive notifications via Telegram, any other internet messenger, or email. Depending on device connectivity and data status (normal, pre-alarm, or alarm), the color of data values and groups changes in real time. Additionally, an operator connected in real-time sees a blinking alarm icon at the top of the screen, which stops blinking only after the operator acknowledges (confirms) the alarm.
Cold Chain Cloud provides a technological log, a user activity log, and a system log. The technological log records all alarms and failures in the technological equipment, as well as user responses to alarms — who acknowledged them and when. The user activity log records configuration and settings changes made within Cold Chain Cloud, projects, groups, and data by specific users at specific times.
Cold Chain Cloud also supports creating process flow diagrams (mnemoschemes) in the form of widgets with active elements. These widgets allow visualization of monitoring and control processes in real-time. Widgets are a customizable option developed per customer specifications and approved according to the client’s technical requirements.
See also:


